Short, independent chapters for experts and newcomers alike—from physics intuition to quoting pitfalls, AI roles in R&D, and a dated policy map of industrial heat-pump refrigerants in major markets. Useful when specialists need clear language for clients and decision-makers. Jump in via the list below or read in order.
Extreme-cold hardware: why we insist on CO₂ (R744) cascade heat pumps?
Conventional fluorocarbon cascade vs CO₂ cascade
Intro paragraph 1
Intro paragraph 2
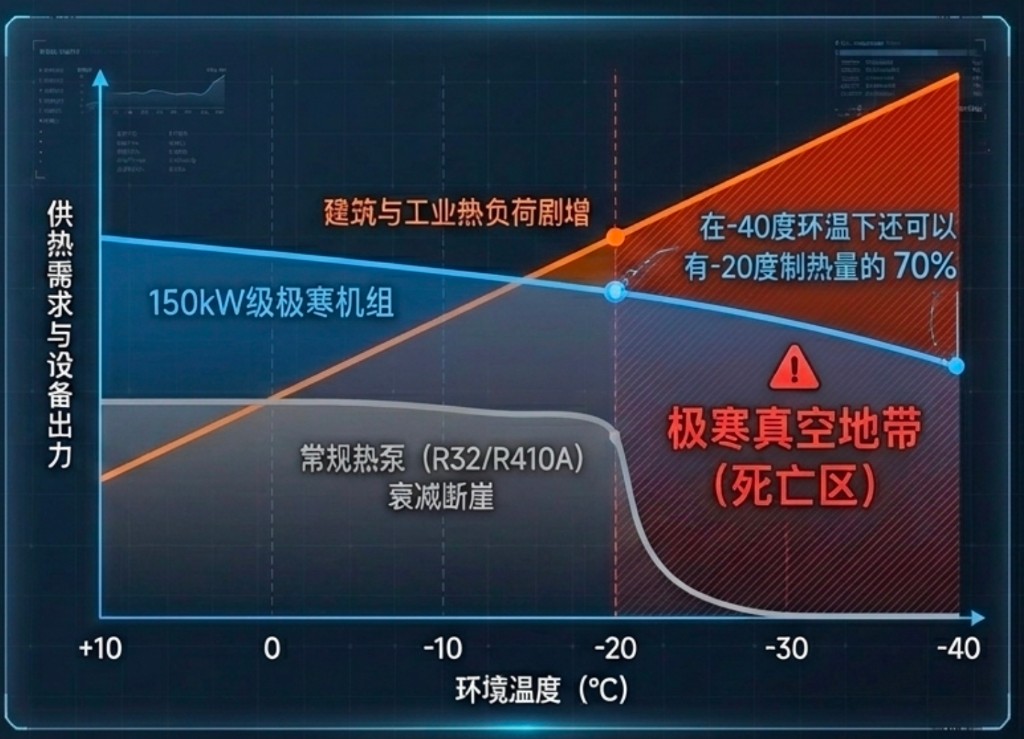
Caption for heating-demand chart.
Comparison
Dimension
Fluorocarbon
CO₂ cascade
Takeaway
Survival at −40 °C
Insight
Heating fade −25 to −30 °C
Insight
Max water outlet
Insight
Environment
Insight
Economics
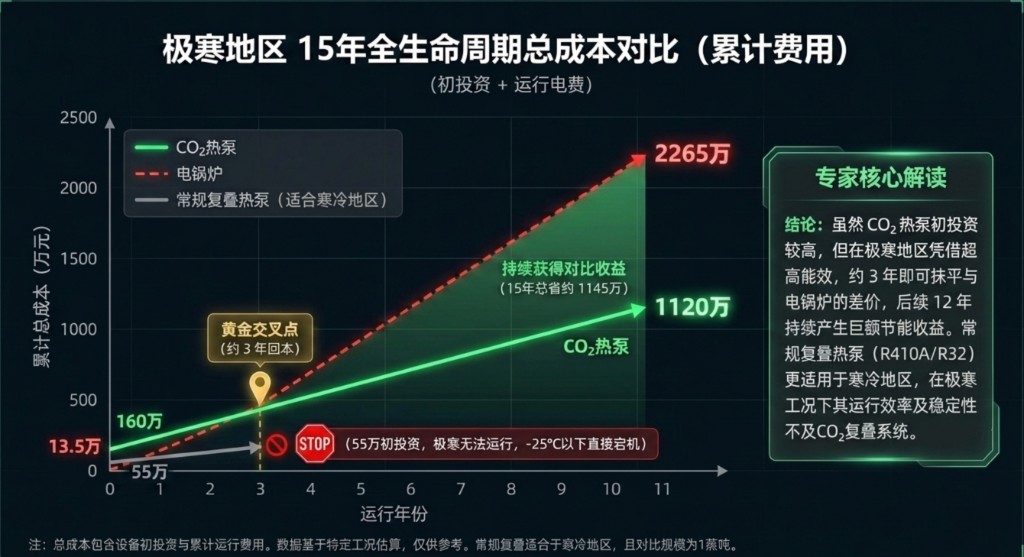
15-year cumulative lifecycle cost in extreme-cold regions
How to read this chart and what the numbers assume.
Business lede
Architecture
Expert note
Warning body
Closing
Part 2 · Cognition
Why boilers feel simple, but heat pumps look “complicated”
A boiler “makes heat”. A heat pump “moves heat”. The moment you must lift heat across a temperature gap, the design space explodes—cycles, fluids, compressors, and integration details.
Why a boiler solves “any heating” so easily
Human version: it’s like a big kettle: fuel/electricity goes in, hot water/steam comes out.
Engineering version: it converts energy to heat directly; you mainly manage combustion/electrics, heat transfer area, and safety codes.
What you “spec”: outlet temperature/pressure and capacity; the rest is relatively standardized.
Why heat pumps branch into so many “types”
Human version: it’s a “heat elevator”: you must lift heat from low temperature to high temperature.
Engineering version: the required temperature lift (ΔT) sets pressure ratio, discharge temperature, and efficiency limits—forcing different cycles.
What you must fit: the heat source, heat sink, temperature curves, and site constraints; the “machine” is only one part.
The 6 real reasons heat pumps look complex
1) Temperature lift (ΔT) changes everything
Small ΔT: single-stage vapor compression may work well. Large ΔT: you may need economizers, two-stage, cascade, absorption, steam compression, or other cycles to stay within safe and efficient boundaries.
2) Heat sources vary wildly
Air, water, brine, flue gas, process waste heat, solvent streams… each brings different fouling, corrosion, freezing risk, and temperature stability—so the “best” cycle and heat exchanger choices change.
3) The heat sink is not just “hot water”
Hot water, hot air, steam, thermal oil—each has different temperature requirements and curve shapes. Matching those curves often matters more than the nameplate COP.
4) Working fluid is constrained by physics + safety + regulation
Not “pick any refrigerant”. Critical temperature, operating pressures, glide, material compatibility, flammability/toxicity class, PFAS/F-gas rules—these constraints push designs into different families.
5) Compressor/expander type sets the feasible operating map
Scroll/screw/reciprocating/centrifugal, vapor vs steam compression, oil-free vs oil-injected—each has a different “safe & efficient” map, affecting cycle choice and staging.
6) Industrial reality: integration and reliability dominate
Plants cannot stop. Redundancy, defrosting, part-load control, bypass, thermal storage, and commissioning measurement turn a heat pump into a system engineering problem—not just a box.
One-sentence memory
Boilers are “energy → heat”. Heat pumps are “heat → higher heat”, so they must obey more boundaries—and boundaries create variants.
Want the cycle families drawn out? Continue in the cycle guide.
Common misconceptions
“Isn’t a heat pump just an air-conditioner in reverse?”
The core idea is related, but industrial heat pumps face much larger ΔT, harsher sources, stricter reliability, and often steam/hot-water targets—so the required cycles and equipment scale are different.
“Can I just pick a higher-COP unit?”
COP depends on your source/sink temperatures and part-load behavior. The best project is usually about process coupling and stable operating hours, not a single catalog COP number.
Part 3 · Pricing & standards
Why “price per kilowatt” for heat pumps rarely lines up
People often ask what one kilowatt of heat-pump capacity “costs”. The question is fine—the missing part is which kilowatt, at which outdoor and water conditions, and whether the denominator is thermal output, electrical input, or a trade “horsepower” habit.
Three common “unit prices”, three different denominators
Money per kW (heating): usually catalog heating capacity at a stated rating point.
Money per kcal/h: another heat-power habit; conversion to kW is fixed, but comparability is not.
Money per “匹” (HP): often a compressor sizing habit or legacy cooling shorthand.
The big trap: conditions not aligned
Comparing “¥ per kW” using a severe-climate nameplate against a mild-climate nameplate is like measuring the same table with two rulers.
Delivering usable heat at -40 °C outdoor versus +7 °C can imply different compressor families and a different bill of materials.
Even “same conditions on paper” can be unfair
Fair comparison needs aligned source/sink temperatures, flow strategy, auxiliary power accounting, defrost definition, and scope of supply.
Takeaway for buyers: ask for three things first—outdoor/source temperature, supply/return water temperature, and nominal vs guaranteed capacity—then talk unit price.
One-sentence memory
Without defined rating conditions and a defined denominator, “money per kilowatt” is a map with no coordinates.
Pricing & rating: quick FAQs
“Isn’t kcal/h and kW the same after conversion?”
The unit conversion is fixed; the engineering problem is not.
“We lined up the same box label conditions—why are quotes still far apart?”
Labels can share similar words while differing in test tolerances, auxiliary inclusion, and supplier boundary.
“Can AI pick the cheapest heat pump?”
AI can organize comparisons; it should not replace hazard analysis and engineer-signed assumptions.
Part 4 · AI & human roles
Can AI fully replace humans in refrigeration & heat-pump R&D?
AI can draft comparisons and summaries, but it cannot carry the judgment, evidence chain, and accountability that refrigeration and heat-pump R&D still require.
1) Confident nonsense (hallucination)
Models can state catalog numbers, codes, or cycle details that were never verified against your source data. In R&D, that misroutes compressor choice, safety margins, and test plans—humans must cross-check against datasheets, experiments, and field evidence.
2) Sycophancy (agrees with the prompt)
If your premise is wrong—say, an impossible ΔT or a mismatched rating point—the model may still sound supportive. Engineering progress needs independent challenge and red-team review, not flattery.
3) Hungry for sensitive data
Real process curves, contracts, and logged plant data are often confidential. AI cannot replace your governance on what may leave the firewall, how to anonymize traces, or who may see which slice of a heat balance.
4) No accountability
Drawings, hazard studies, warranties, and incident responsibility still sit with licensed people and organizations. An AI transcript is not a signed engineering assumption—and should not be treated as one.
5) Makes teams lazy
Over-delegating first-principles checks erodes intuition for thermodynamic limits and system integration. R&D still rewards people who can sanity-check a line of reasoning when the tool is silent or wrong.
One-sentence memory
Use AI to organize and draft; use qualified humans to judge, verify, and sign—especially wherever safety, data custody, and lifecycle risk meet the heat pump.
Part 5 · Refrigerants & policy
Industrial heat-pump refrigerants: how China, the EU, and the US pull policy in different directions
Comfort HVAC and industrial heat pumps share refrigerant names, but industrial plants often mean higher temperatures, larger charges, and tougher on-site rules.
This chapter is a brief orientation only. See the Refrigerants guide for full policy maps and the property table.
Heat pumps are sold as low-carbon—why can measured emissions beat a gas boiler?
AI industrial heat pump expert · Q&A
The contradiction is real in many project spreadsheets—but it is usually not because heat pumps are “physically dirtier” than gas. More often, people compare different kinds of carbon, different system boundaries, or brochure COP against field gas use.
Simple examples: when is carbon lower or higher?
Use the same operating-carbon shortcut: heat pump ≈ grid factor ÷ system COP; gas boiler ≈ gas factor ÷ boiler efficiency. Numbers below are illustrative only—replace with your audit factors.
Heat pump often wins (lower kgCO₂ per kWh of heat)
Gas boiler often wins (heat pump looks “dirtier”)
Rule of thumb with the illustrative factors above: if system COP is well above grid factor ÷ gas factor × boiler efficiency (roughly COP ≳ 2.5–3 for a 0.55 grid and 90% gas boiler), the heat pump tends to win on operating carbon; below that, gas can catch up or lead.
1) Align what “carbon” means first
Scope 1 at the site: gas boilers emit CO₂ from combustion; heat pumps have no stack—so chimney-only accounting makes heat pumps look perfect. Operating carbon: electricity × grid emission factor—where heat-pump emissions actually live. LCA / corporate inventories may add manufacturing, refrigerant leakage (GWP), and logistics; gas-only “fuel use” comparisons are not the same ledger.
2) Grid emission factor can veto the conclusion
Average vs marginal factors, regional vs national defaults, and outdated yearbooks all swing results. Rough operating intensity: heat pump ≈ EFgrid / COPsystem; gas boiler ≈ EFgas / ηboiler (include pumps, fans, defrost, and standby in COPsystem). When COPsystem is low or EFgrid is high—common in high-temperature industrial lifts—heat pumps can lose on carbon even if the brochure COP looks fine. Always use the factor your carbon audit or contract requires.
3) Field COP is often far below catalog COP
Large temperature lift (steam / high-temperature water), part load, frequent stops, defrost, and antifreeze cycles all drag real performance—see Part 2 · Cognition and Part 3 · Pricing & standards for why industrial duty differs from comfort ratings. Auxiliary power (source pumps, cooling towers, controls, trace heating) is often left out of “compressor COP”. Comparing a +7 °C air-source nameplate to a 120 °C steam heat pump’s annual curve will distort carbon accounting.
4) Unfair system boundaries
Boiler comparisons often stop at “furnace efficiency”. Heat-pump quotes sometimes count only the compressor while omitting source-side heat exchange, distribution pumps, thermal storage, backup electric or gas peaking, and tower/fan power—so equipment COP looks good while system carbon does not.
5) Operating strategy and power mix
Grey grid without green power or PPA caps how “clean” electrified heat can be. Long hours on electric backup or gas peaking in cold windows load high-carbon energy into the heat-pump scheme total. A condensing gas boiler at high load factor vs a heat pump idling at low load compares “best boiler hour” to “worst heat-pump window”. For assessment context, see industrial heat pump policies (encouragement → mandatory carbon metrics).
6) Fair comparison checklist
Before declaring a winner, walk this list with the same period, boundary, and emission factors:
One-sentence memory
A heat pump is not born green—greenness ≈ how clean the grid is × how high system COP is × whether the boundary is complete.
“The heat pump has zero emissions on site—why does the report say it’s worse than the gas boiler?”
Because indirect emissions from electricity—and often omitted auxiliary loads—are included. Stack zero ≠ carbon zero.
“COP 2—doesn’t that automatically beat a gas boiler on carbon?”
Not necessarily. It depends on EFgrid, boiler efficiency, system boundary, and operating hours. In coal-heavy regions or low system COP, gas can win on operating carbon intensity.
“How do we make the heat pump genuinely beat the boiler on carbon?”
Raise weighted system COP and process coupling, cut auxiliaries and peaking hours, add green power or storage, and run the comparison with audited factors—not AI-invented grid or COP numbers.
Emission factors and carbon accounting rules vary by region and reporting regime; this chapter is engineering orientation, not a carbon audit or legal opinion.
Part 7 · Refrigeration & heat pump expert
Refrigeration/heat-pump compressor “匹” (HP): what it means—and what it does not
Refrigeration & heat pump expert · Q&A
In the trade, “60P” sounds like a fixed size. In engineering, it is often three different things at once—and the rating temperature you never asked about can move real delivered kW by a large margin. This chapter untangles 匹 vs kW, refrigerant and operating conditions, what national standards actually say, and why two “same horsepower” quotes are not the same machine.
Case study: both say 60P—why is one quote much higher?
A common field story: two suppliers both offer 60P air-source heat pumps. One price looks “expensive”; the other looks like a bargain. After installation, the owner finds the cheaper box was rated at +7 °C outdoor air and moderate leaving-water temperature, while the premium unit was sized for −12 °C ambient and higher supply water—different hardware tiers, not the same product mis-priced. Numbers below are illustrative; always use each vendor’s rating sheet.
Quote A — severe-climate rating (higher CAPEX is often rational)
Quote B — mild-climate rating (lower sticker, different duty class)
Same “60P” label ≠ same heating kW at your site. Higher price is not automatically margin; lower price is not automatically a steal—often it is a different rating tier. See also Part 3 · Pricing & standards (“two rulers, one table”).
1) Three “匹” habits—do not mix them
Motor / frame class: OEM catalogs (Bitzer, Dorin, etc.) often use HP for motor power or product series—not guaranteed system heating kW. Cooling-capacity shorthand: in Chinese HVAC trade, 1 匹 ≈ 2.5 kW cooling at a historical comfort rating point—already refrigerant- and condition-dependent. Marketing label: “60P” on a brochure may summarize none of the above consistently. Before comparing ¥/匹, ask which definition the seller uses.
2) Strongly tied to operating conditions
For the same compressor displacement, changing evaporation and condensation temperatures shifts mass flow, volumetric efficiency, and power—so heating/cooling kW moves. There is no “匹” detached from source temperature, sink temperature, and part-load point. −12 °C vs +7 °C outdoor air is not a small correction; it can change compressor family, reinjection/cascade, defrost, and heat-exchanger area.
3) Strongly tied to refrigerant
Switching fluid—R134a, R410A, R32, R515B, R744, ammonia, etc.—changes suction density, pressure ratio, and discharge temperature. The same frame “HP class” therefore maps to different kW on the performance map. Cross-brand 匹 comparisons without aligned refrigerant and rating point are unreliable.
4) What national standards actually use
Chinese product and test standards express nominal capacity in kW at specified rating conditions—not “匹” as the legal unit. Examples on this site’s standards quick reference: GB/T 18430.1 (industrial/commercial water chilling & heat pump packages), GB/T 25127.1 (low-ambient air-source, cold-climate oriented), GB/T 10870 (performance test methods referenced by those families). Procurement contracts should cite kW + outdoor/source temp + supply/return water (or sink) temp, not 匹 alone.
5) Fair comparison checklist (pairs with Part 3)
Before ¥/匹 or ¥/kW, align:
One-sentence memory
“匹” is a spoken label; kW @ stated conditions is engineering language. Comparing 匹 without aligned rating points is ordering without units.
Trade habit often uses ~2.5 kW cooling at a comfort rating point—but that is not a universal heating kW. For procurement, demand the vendor’s kW table at your source/sink temperatures, not a mental conversion factor.
“The brochure says 60P—is that recognized by GB standards?”
Standards recognize kW at defined test conditions (see GB/T 18430.1, GB/T 25127.1, GB/T 10870). “匹” remains market shorthand. Contracts should state kW, ambient/source temperature, and water temperatures—not 匹 alone.
“Can we size across brands using 匹?”
Only as a coarse filter. Final selection needs aligned refrigerant, evaporation/condensation (or air/water) temperatures, heating vs cooling duty, and whether auxiliaries are inside the supplier boundary.
“How does this relate to Part 3’s ¥/kW chapter?”
Part 3 explains why denominators misalign. This chapter explains why “匹” is one of the most confusing denominators—and why two identical 匹 numbers can imply different machines and prices.
OEM maps, standard editions, and project warranties vary; this chapter is engineering orientation for buyers and integrators, not a substitute for type-test reports or signed specifications.
Part 8 · Coupling & operating economics
Gas–electric price ratio & breakeven COP: coupling heat pumps with gas boilers
Coupling & operating economics · Q&A
When gas is cheap relative to electricity, a heat pump must deliver a higher COP to win on the bill—and in cold or defrost hours it often cannot, so coupled systems exist for a reason.
Define the ratio and breakeven COP*
Use consistent units. Natural gas LHV ≈ 9.87 kWh/m³—confirm with your gas contract.
Higher r → lower COP* → heat pump wins more hours.
Do not confuse COP* with Part 6’s carbon breakeven
Part 6 uses emission factors; this chapter uses tariffs—similar numbers, different ledgers.
Three illustrative cases (building / district heating)
Illustrative only—replace with contract prices and field COP curves.
Case A — heat pump wins on cost
Case B — gas boiler wins this window
Case C — why hybrid beats all-heat-pump or all-gas
Three common coupling patterns
1) Parallel on one supply loop
2) Heat pump primary + gas peaking
3) Time-of-use dispatch
Industrial high-temperature duty pushes COP* up—this chapter focuses on building hot-water heating.
1) The gas–electric ratio is not a constant
Tiered gas and time-of-use electricity move r through the year.
2) COPsystem ≠ catalog COP
Dispatch on measured hourly COP, not a brochure line.
3) Capacity and comfort constrain the choice
COP* is fuel cost; capacity is deliverable kW.
4) Reliability is not the same as economy
Backup boiler hours may be poor economics yet good engineering.
5) Align system boundaries
Include auxiliaries in both η and COPsystem.
6) Integrator / owner checklist
Before writing dispatch logic:
One-sentence memory
Coupling is hourly marginal cost: COP* from r and η; run heat pump when COPsystem beats COP*.